
View the PDF here
Sensors and Machine Learning Models to Prevent Cooktop Ignition and Ignore Normal Cooking
By: Amy E. Mensch, National Institute of Standards and Technology, United States
Anthony Hamins, National Institute of Standards and Technology, United States
Wai Cheong Tam, National Institute of Standards and Technology, United States
Z.Q. John Lu, National Institute of Standards and Technology, United States
Kathryn Markell, National Institute of Standards and Technology, United States
Christina You, National Institute of Standards and Technology, United States
Matthew Kupferschmid, National Institute of Standards and Technology, United States
According to a recent NFPA report, 49 % of reported home fires involve cooking equipment, with cooktops accounting for 87 % of cooking-fire deaths and 80 % of the civilian injuries [1, 2]. Between 2014–2018, U.S. fire departments responded to an estimated 172,900 home cooking fires per year, leading to an average of 550 civilian deaths [2].
Electric-coil cooktops in the U.S. manufactured after June 2018 must pass the abnormal cooking test in UL 858 [3]. The test prescribes a maximum temperature of the dry-pan or a performance test for ignition-prevention using 50 mL of canola oil with the coil element on its highest power setting. This standard does not apply to older cooktops or gas cooktops. Therefore, we consider the feasibility of using a variety of sensors as the basis for a retrofit device that would provide early warning or control to automatically shut off the cooktop during unattended cooking, while ignoring normal-cooking activities.
Several studies [4–9] have investigated the performance advantages of multiple sensors over a single sensor for detecting generalized fire conditions, preventing cooktop ignition, or resisting nuisance sources. However, a comprehensive study to compare the effectiveness of a wide range of sensors and sensor combinations has not previously been conducted. This article is a compressed version of a recently published study [10] with an objective to apply data-driven, statistical methods and machine learning methods to design a detection algorithm for cooktop ignition prevention. Data was obtained from experiments with a variety of ignition and normal-cooking scenarios to develop and evaluate prediction algorithms using threshold analysis and neural network models.
Experimental Methods
Sixty ignition and normal-cooking experiments were conducted in a mock kitchen shown in Figure 1 using different size electric-coil heating elements, gas burners or an electric oven. Sixteen sensors were placed in the exhaust duct where they were exposed to the well-mixed exhaust flow containing the cooking gases and particles. The sensors monitored various quantities including CO2, CO, temperature, humidity, smoke, hydrocarbons (HCs), alcohols, hydrogen (H2), natural gas, propane, volatile organic compounds (VOC), and dust/aerosols. The exhaust fan was normally set to the highest setting on the range hood, with an average velocity of 3.4 m/s in the 15 cm duct. Aluminum foil was added on the sides of the cooktop to reduce the impact of room air currents on the plume. Additional details about the setup and sensor operating principles are found in [9].
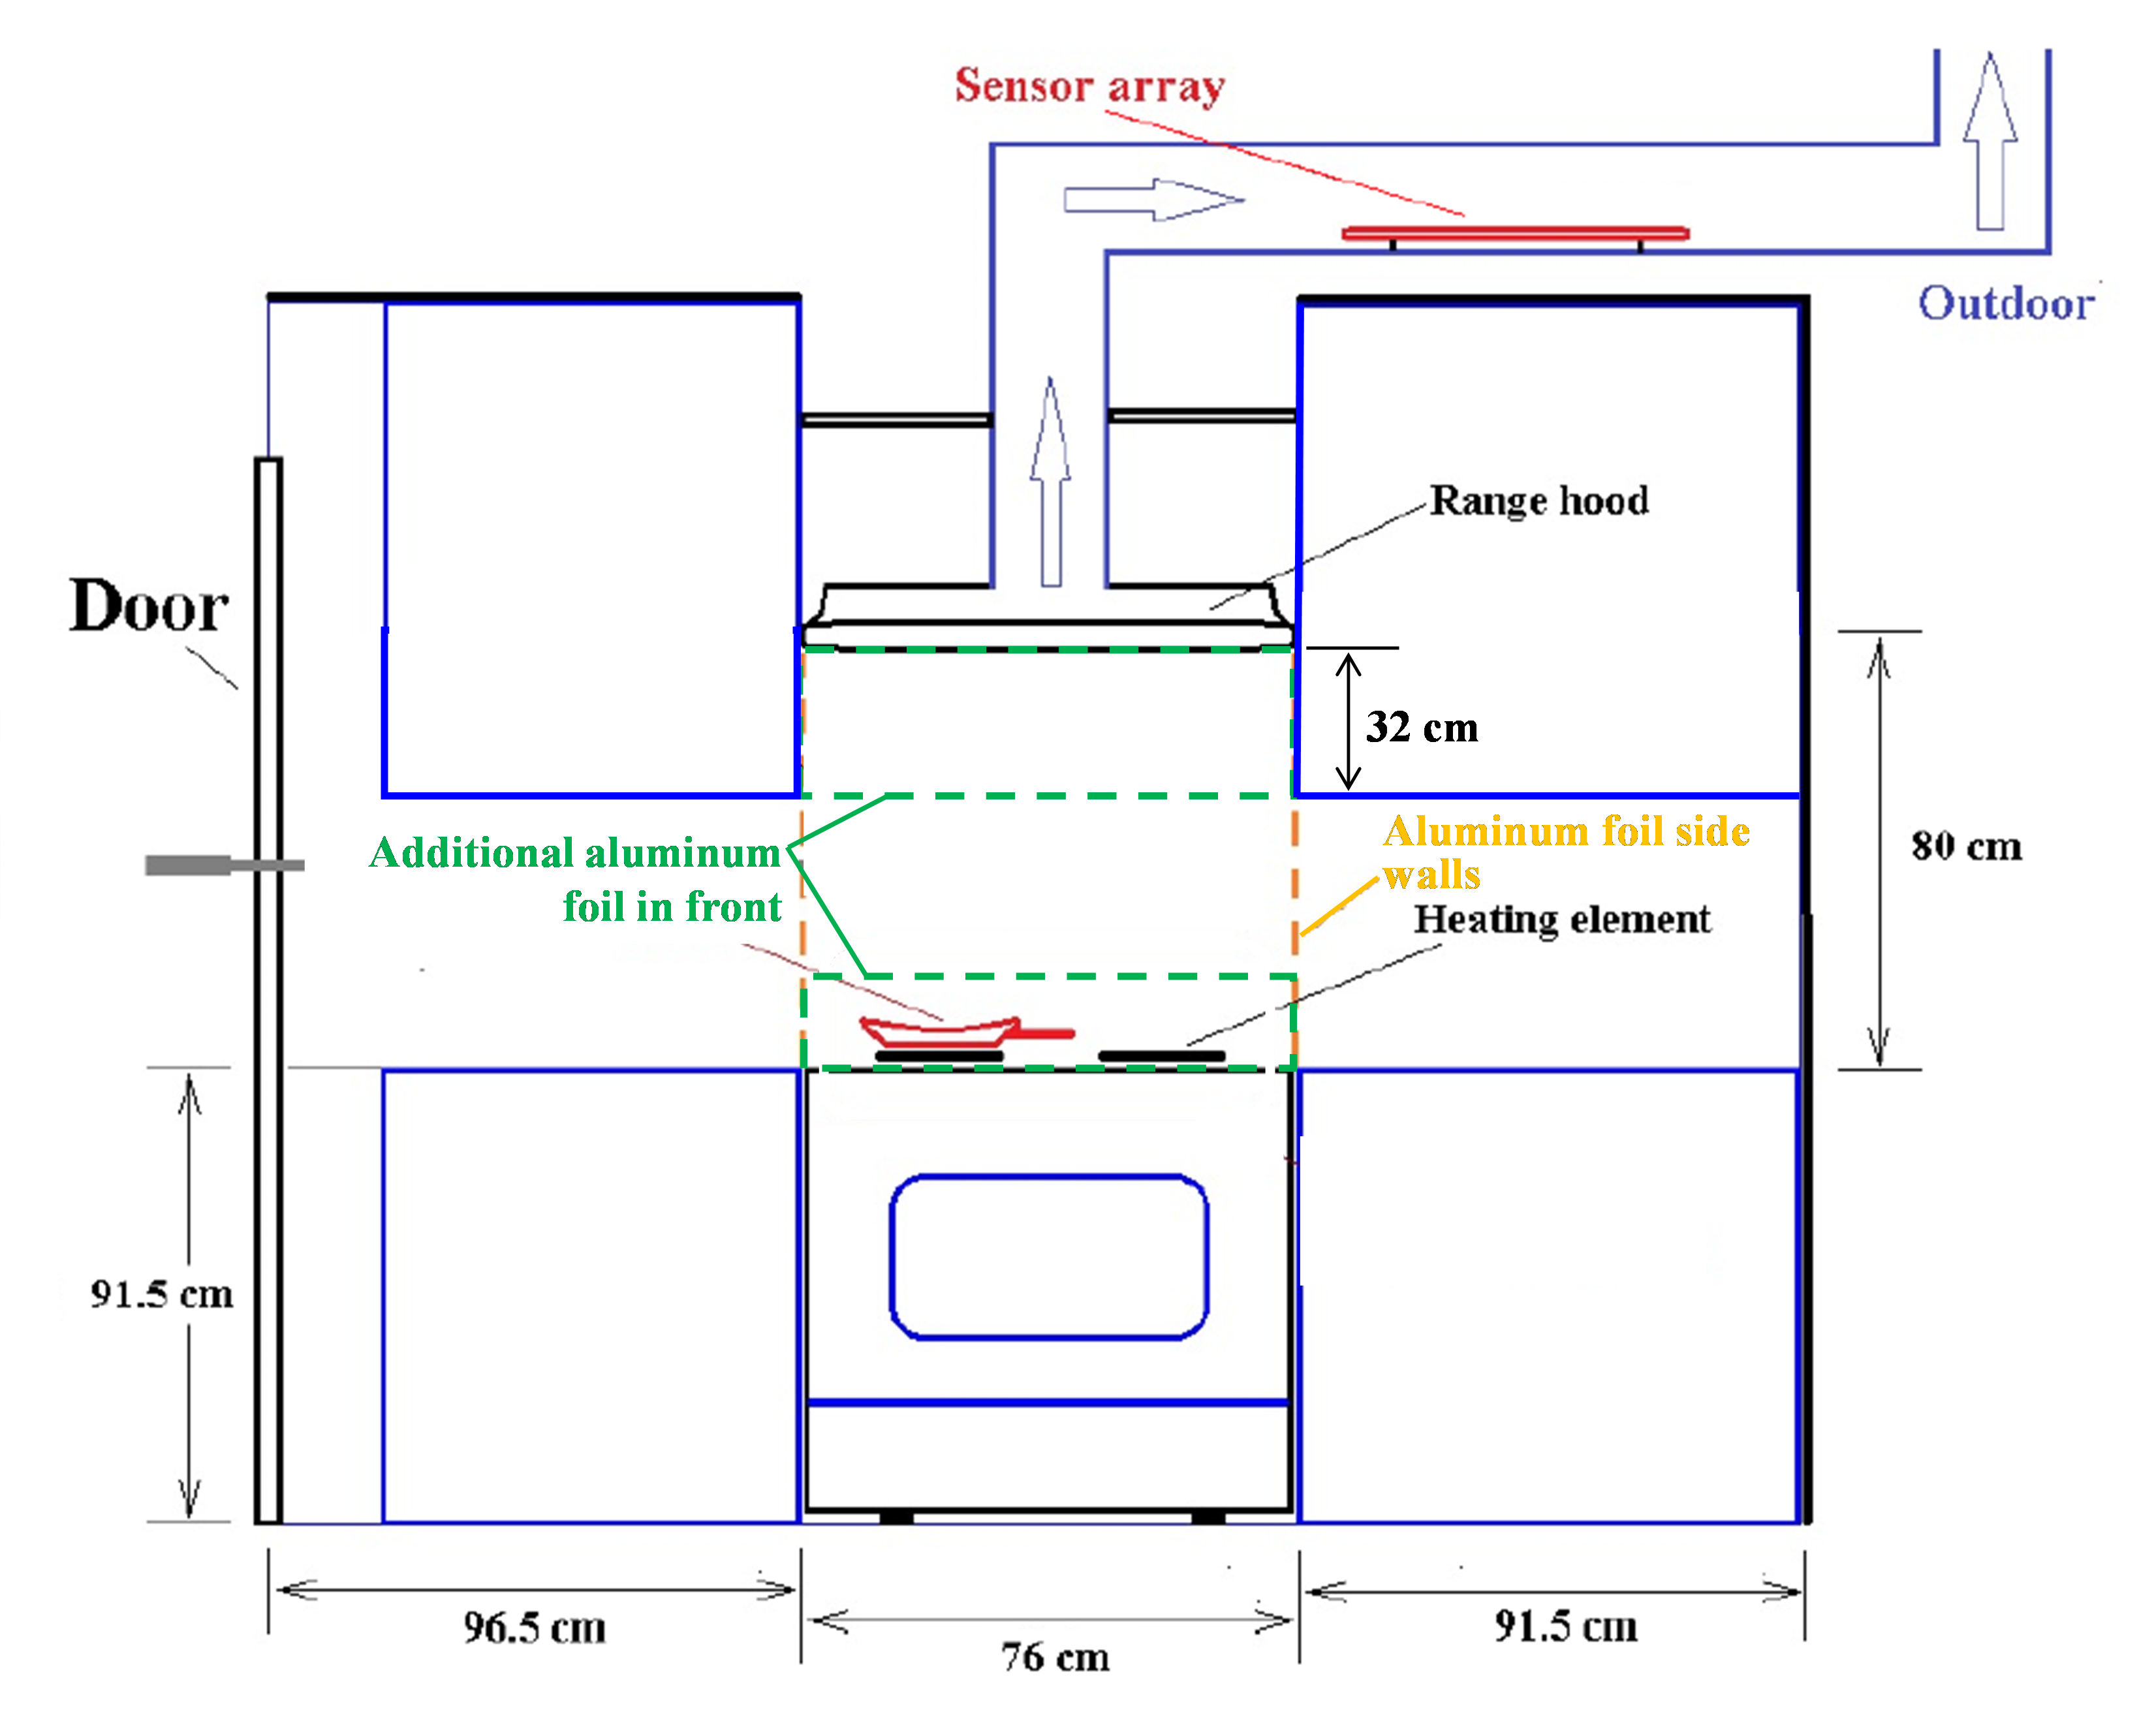
Figure 1. Schematic of the front of the mock kitchen experimental setup (not to scale).
The cooking scenarios covered a wide range of conditions representative of normal cooking as well as conditions beyond normal cooking, sometimes leading to ignition of the food [10–13]. The experiments used 20 cm or 25 cm diameter pans of different types, but mainly cast iron. The foods in the experiments (mostly with high fat content that were likely to ignite) were vegetable oils commonly used in the U.S. [13] (soybean, canola, olive, sunflower, and corn), butter, water, hamburgers, salmon, bacon, frozen french fries, and chicken. In total, 39 out of 60 experiments ignited, including cooking oils, salmon, fries, and bacon.
Pan temperatures were measured at one or more locations using Type-K thermocouples either spot welded or peened to the pan. Figure 2 shows the thermocouple measurements on the pan surface during an experiment with canola oil. The average peak pan temperature at ignition across experiments was 429 °C (standard deviation of 25 °C). For the electric-coil experiments, the pan temperature at the time of ignition was between 403 °C and 483 °C, consistent with previous studies [14].
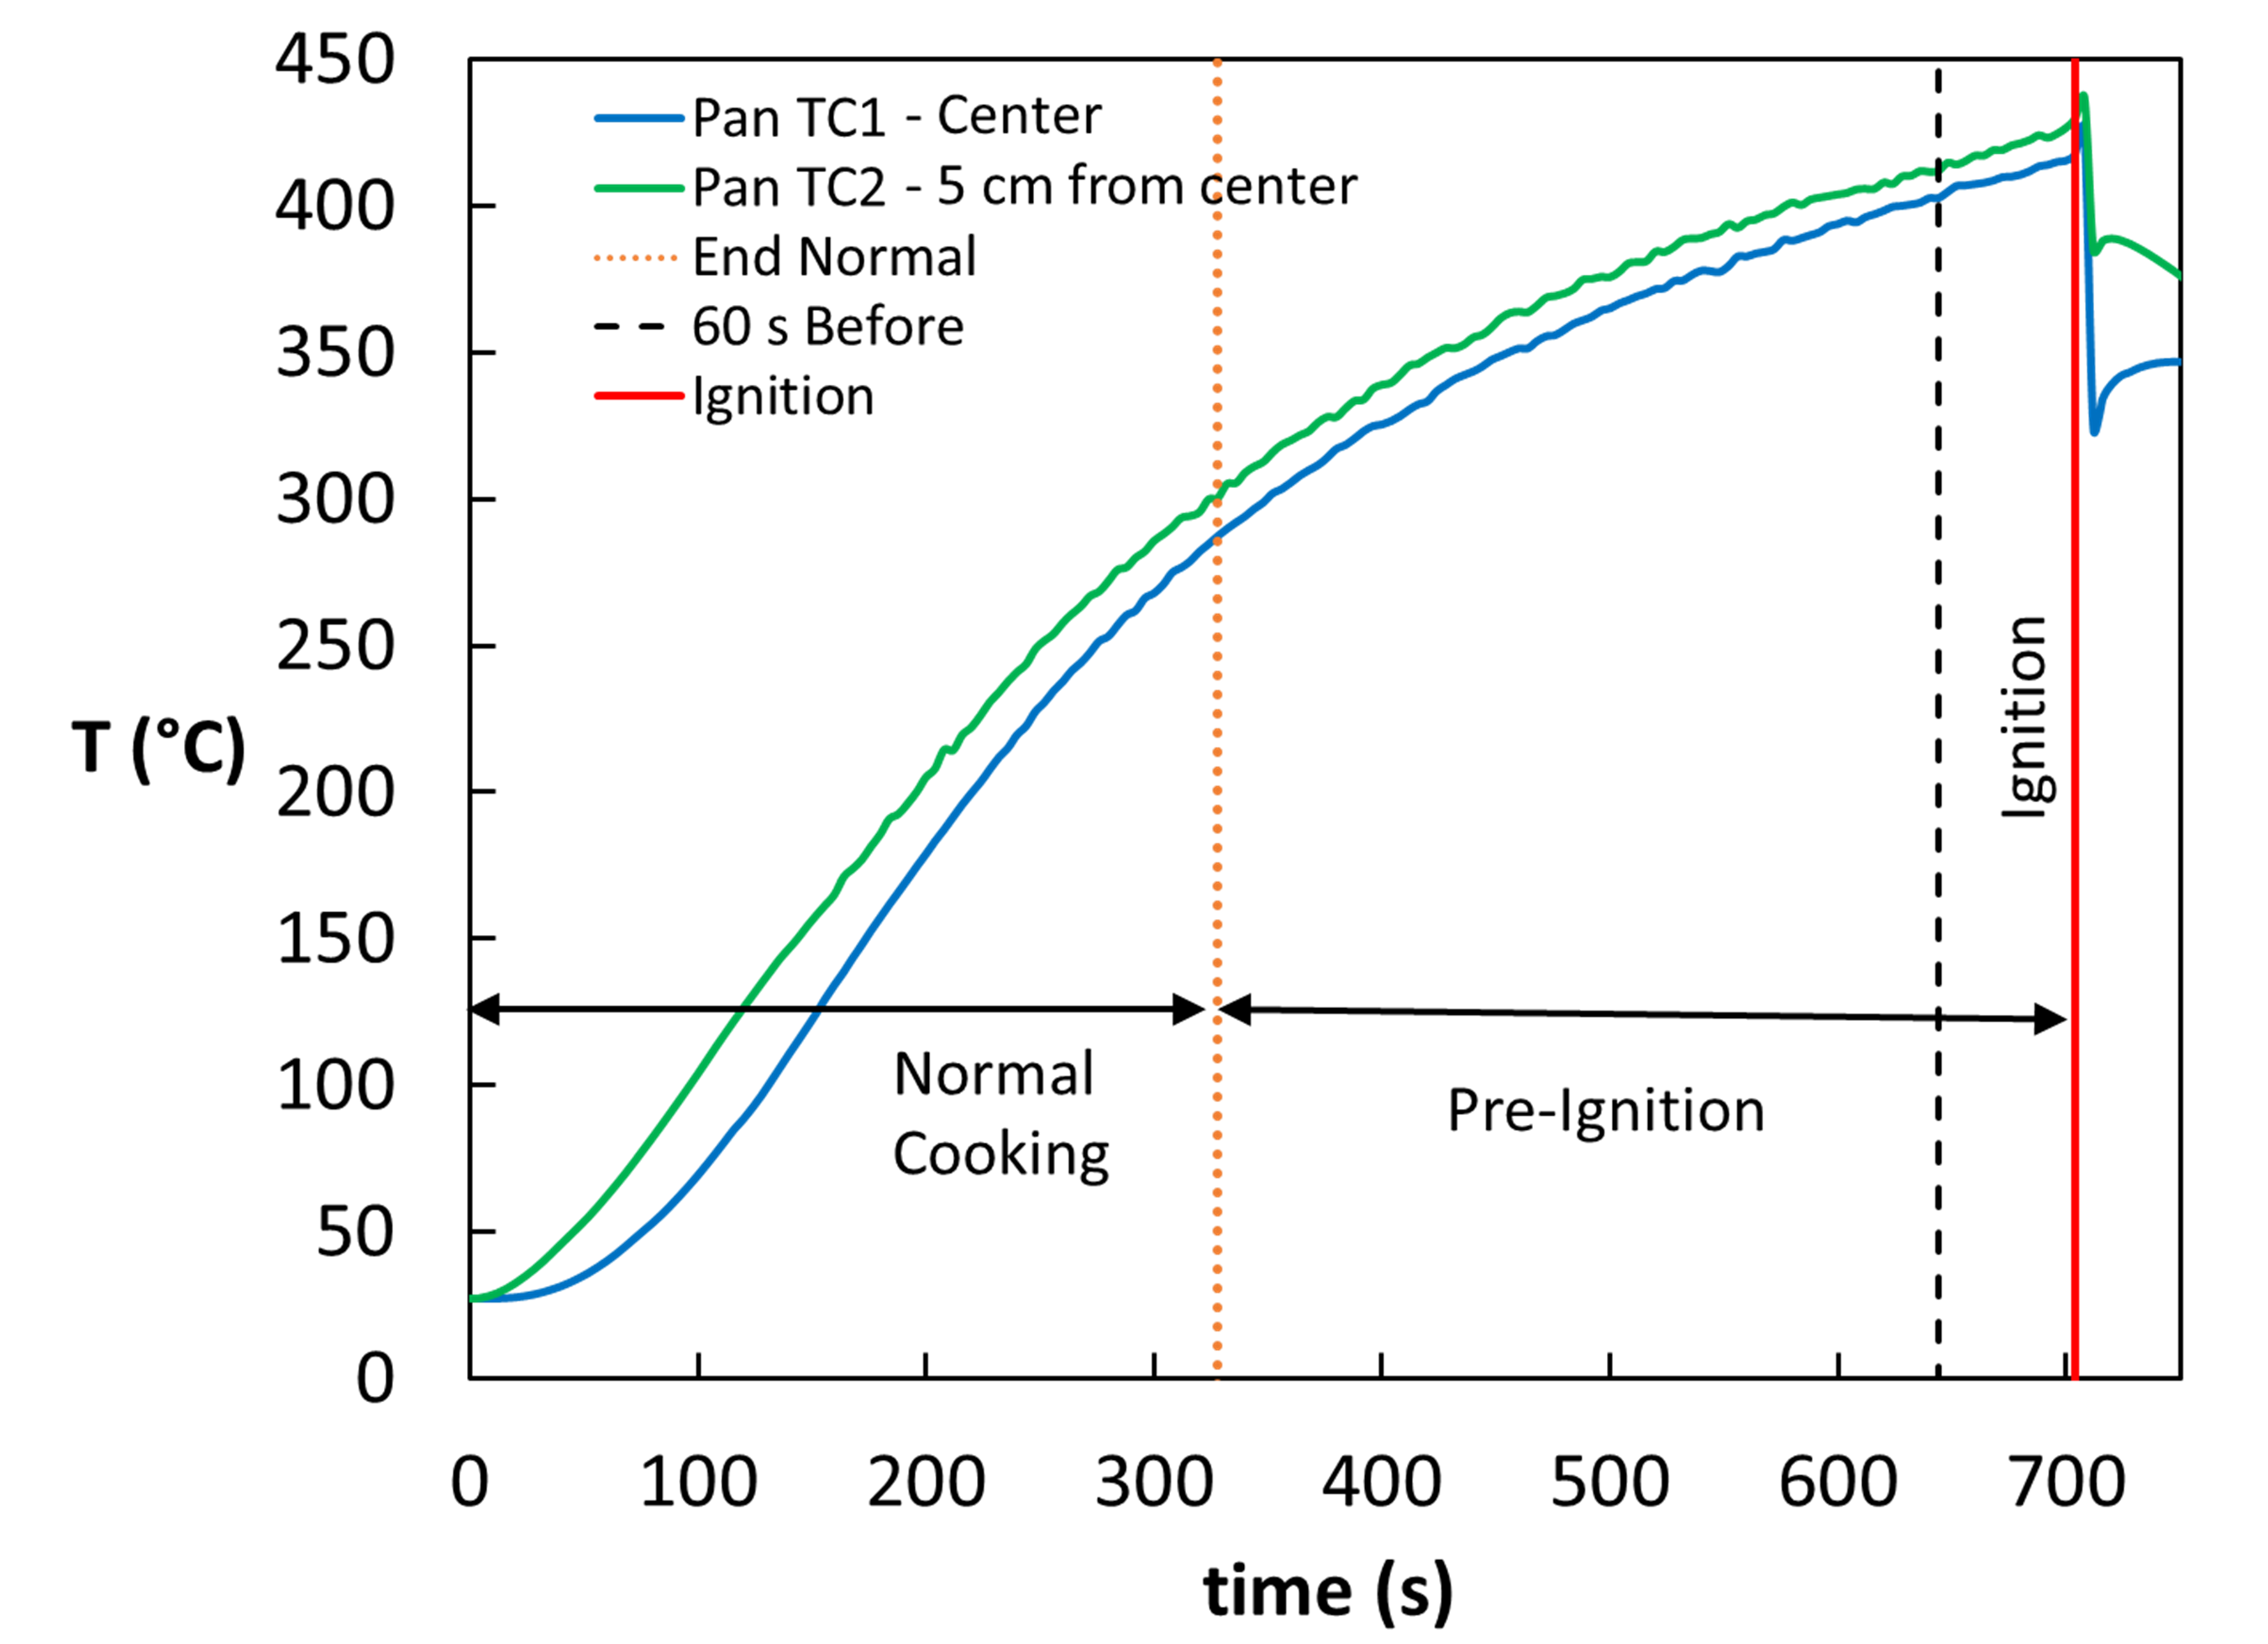
Figure 2. Pan surface temperatures and cooking regimes for an experiment leading to ignition of canola oil.
Figure 2 illustrates three periods of a typical experiment: normal cooking, pre-ignition, and ignition. The transition to pre-ignition occurs when conditions exceed some reasonable temperature- or time-based limit and involve severely burned food and copious amounts of aerosol being produced. The limits of normal cooking are based on either a maximum food temperature or the duration of cooking at an approximate pan temperature. For vegetable oils, butter, and bacon, it is assumed that pan temperature is a good indication of the food temperature, and the limit is set to 300 °C. For cooked meats the safe minimum internal temperatures [15] defines the end of normal cooking. Complete details of the definitions for each scenario are described in [10].
Strategically, algorithms to prevent ignition should be triggered after normal cooking but before ignition, allowing enough time to intervene, considering the thermal lag of the burner-pan system. Temperature results from our experiments and previous work [7, 10] suggest that a sufficient time is 60 s before ignition.
Sensor Analysis
Each sensor signal was characterized by a unique profile, and 11 sensors tended to increase in time as ignition approached, as shown in Figure 3. The complete set of sensor data for all experiments is reported in [17].
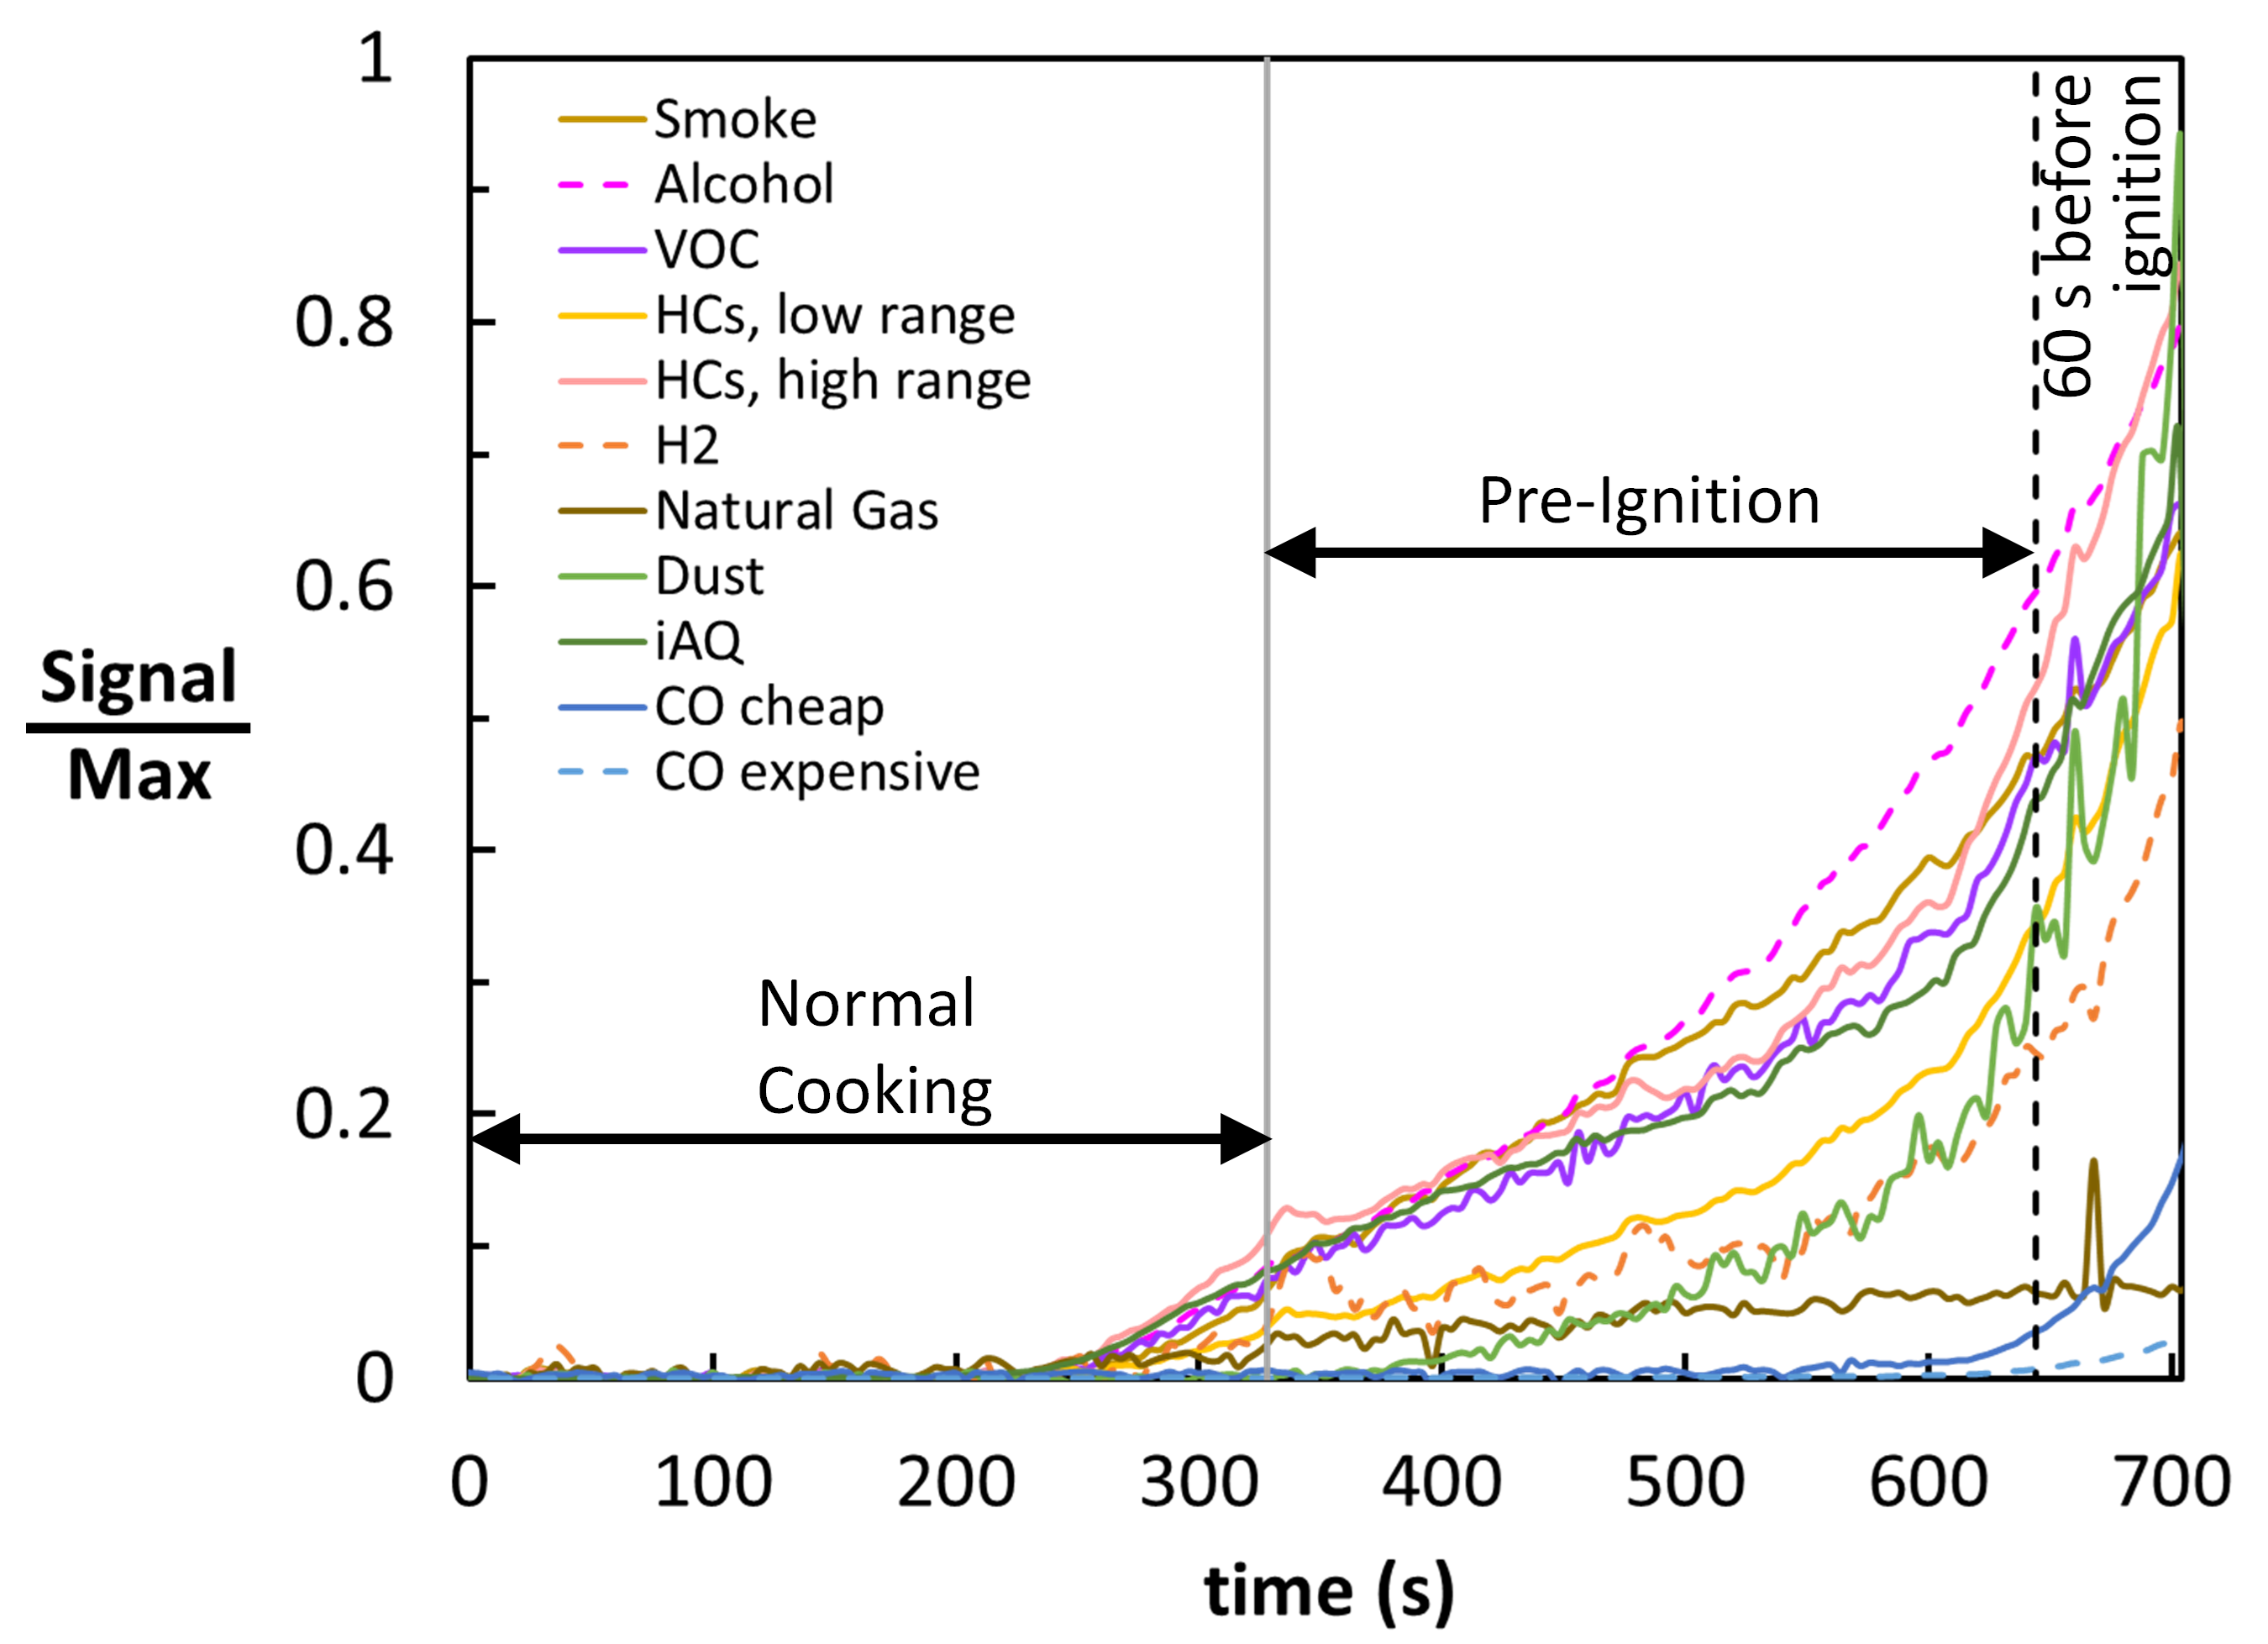
Figure 3. Sensor signals for an experiment leading to ignition of canola oil in a cast iron pan on an electric-coil burner (IAQ is “indoor air quality”).
Threshold Analysis
Sensor signals and their ratios were evaluated across all experiments to determine if a threshold value could be selected to both prevent ignition and ignore normal-cooking conditions. A threshold value could potentially miss ignitions (not trigger before the 60 s ignition window) as well as cause false alarms (trigger during normal cooking). We sought the most conservative threshold that would prevent all ignitions. The false alarm rate (FAR) was the ratio of the number of experiments with a false alarm to the total number of experiments. The sensor ratios considered used either CO2 (mole fraction), duct temperature (K), or humidity (mole fraction of water) in the denominator.
Neural-Network Analysis
Machine learning was also used to classify sensor data as representing normal cooking or pre-ignition conditions, and a similar performance metric was used. The sensor signals were used to train a four-layer feed-forward neural network to differentiate between normal cooking and pre-ignition conditions [10]. Each time point was labeled with a "0" during normal cooking and "1" during pre-ignition. The analysis considered over 12 800 time points across all experiments. Cross-validation was used, where the neural-network model was trained using data from 59 experiments and then tested on the last experiment, and this was repeated until each experiment was used once as the test set. The output was the model prediction for the probability of pre-ignition for each time point. These values were converted to 0 or 1 (using predictions thresholds of 0.5, 0.8, 0.9, 0.98) to compare to the experiment labels.
Twenty-eight unique combinations of sensor data sets were used to develop neural-network models, including one baseline case (using 11 sensors), 11 single sensor cases, and 16 unique pairs of sensors, selected from the best performing individual sensors. Seven cases were repeated to characterize model repeatability. The overall performance was evaluated by quantifying the FAR (the same as in the threshold analysis discussed above) and the missed ignition rate (MIR), which was the number of missed ignition experiments (where the predicted value did not reach the threshold before the ignition window) divided by 39, the number of experiments with ignition.
Results
Threshold Results
The performance for the eight individual sensors with the lowest FAR’s (threshold values in [10]) as well as their ratios with duct temperature, humidity, and CO2 are shown in Figure 4. The VOC sensor has the best individual sensor performance with a 0.02 FAR, or one false alarm, which occurred while cooking hamburgers on a cast-iron pan on an electric-coil burner. The next best performing sensors were IAQ and dust. The sensor ratios with duct temperature generally performed similar to the sensor alone, including the VOC / duct temperature ratio. A few sensor ratios showed improved performance over the sensor alone, especially the HC’s, low range / humidity ratio.
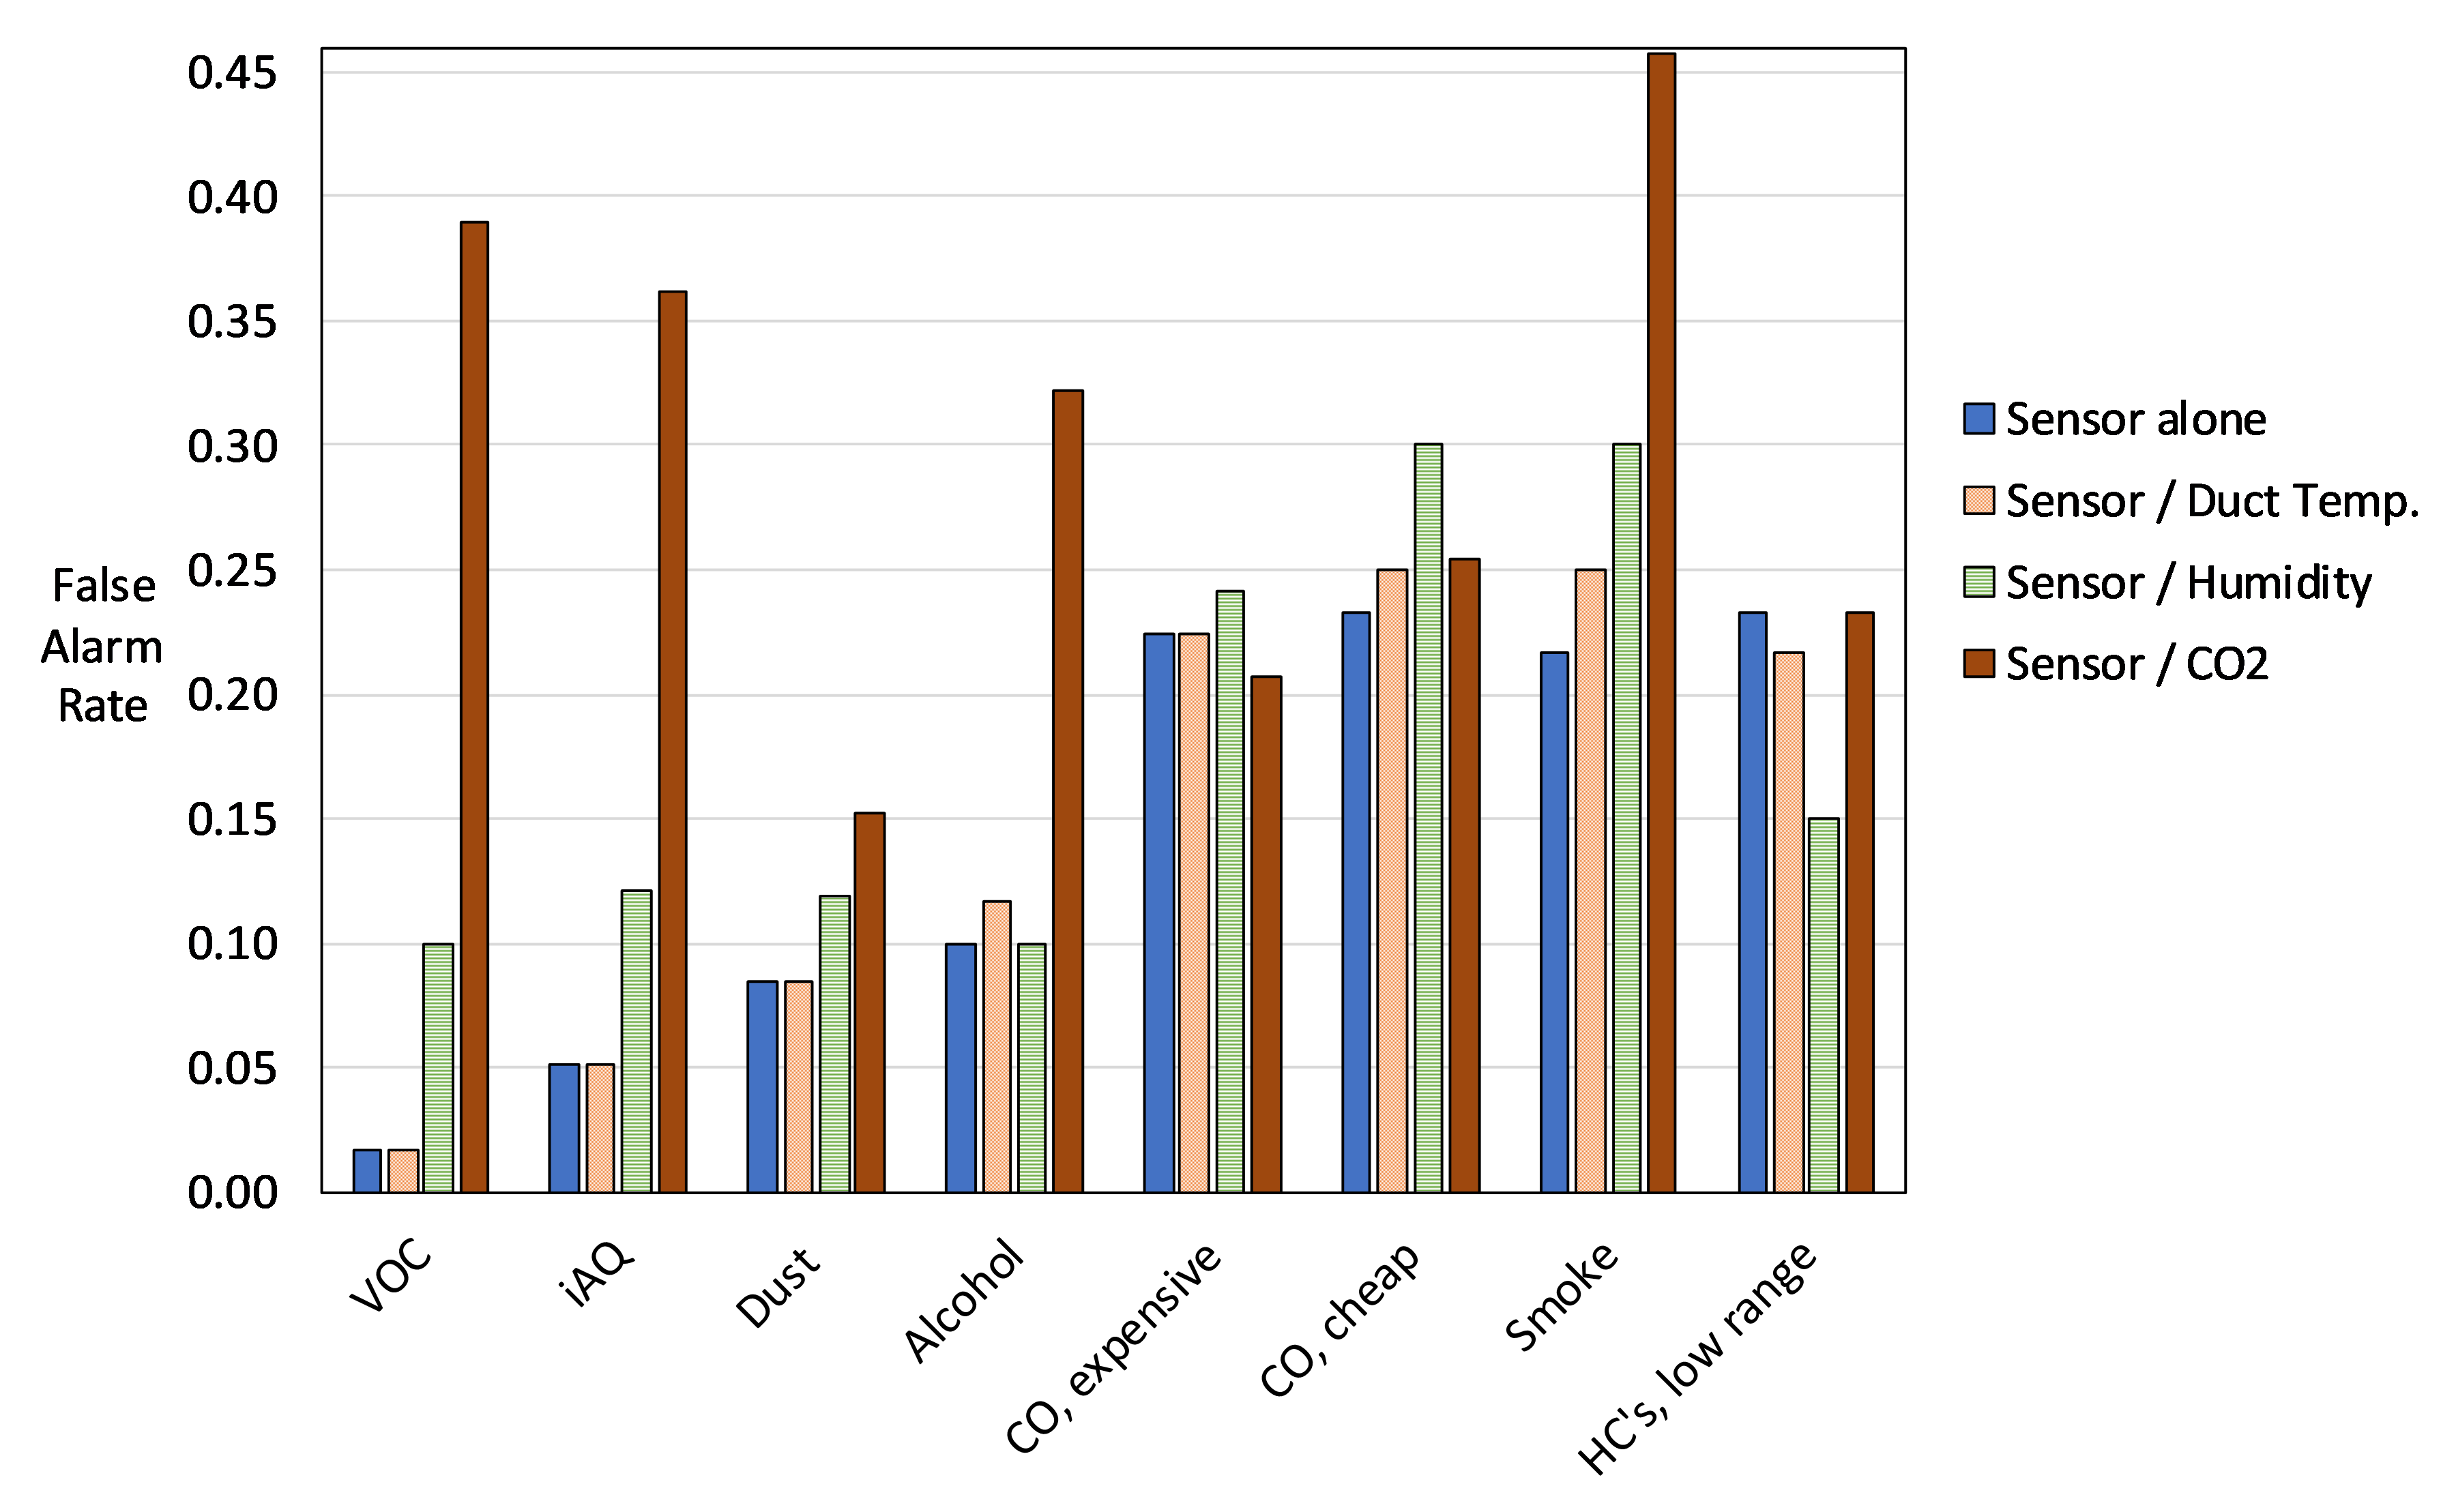
Figure 4. Threshold FAR of the top performing individual sensors and their ratios.
Neural-Network Analysis
An example output of the neural-network analysis is given in Figure 5, which shows the baseline model predictions for one experiment. In this case, any of the four prediction thresholds results in detection well ahead of the ignition window. However, both the 0.5 and 0.8 thresholds are reached before the end of normal cooking, and are considered false alarms. Figure 6 shows that as the prediction thresholds increased, the FAR decreased and the MIR increased except for the baseline models, which had zero missed ignitions for all prediction thresholds tested. For each set of sensor data, the lowest FAR with zero missed ignitions is considered for comparison to signal threshold performance.

Figure 5. Baseline (11 sensor) neural-network model predictions using different prediction thresholds.
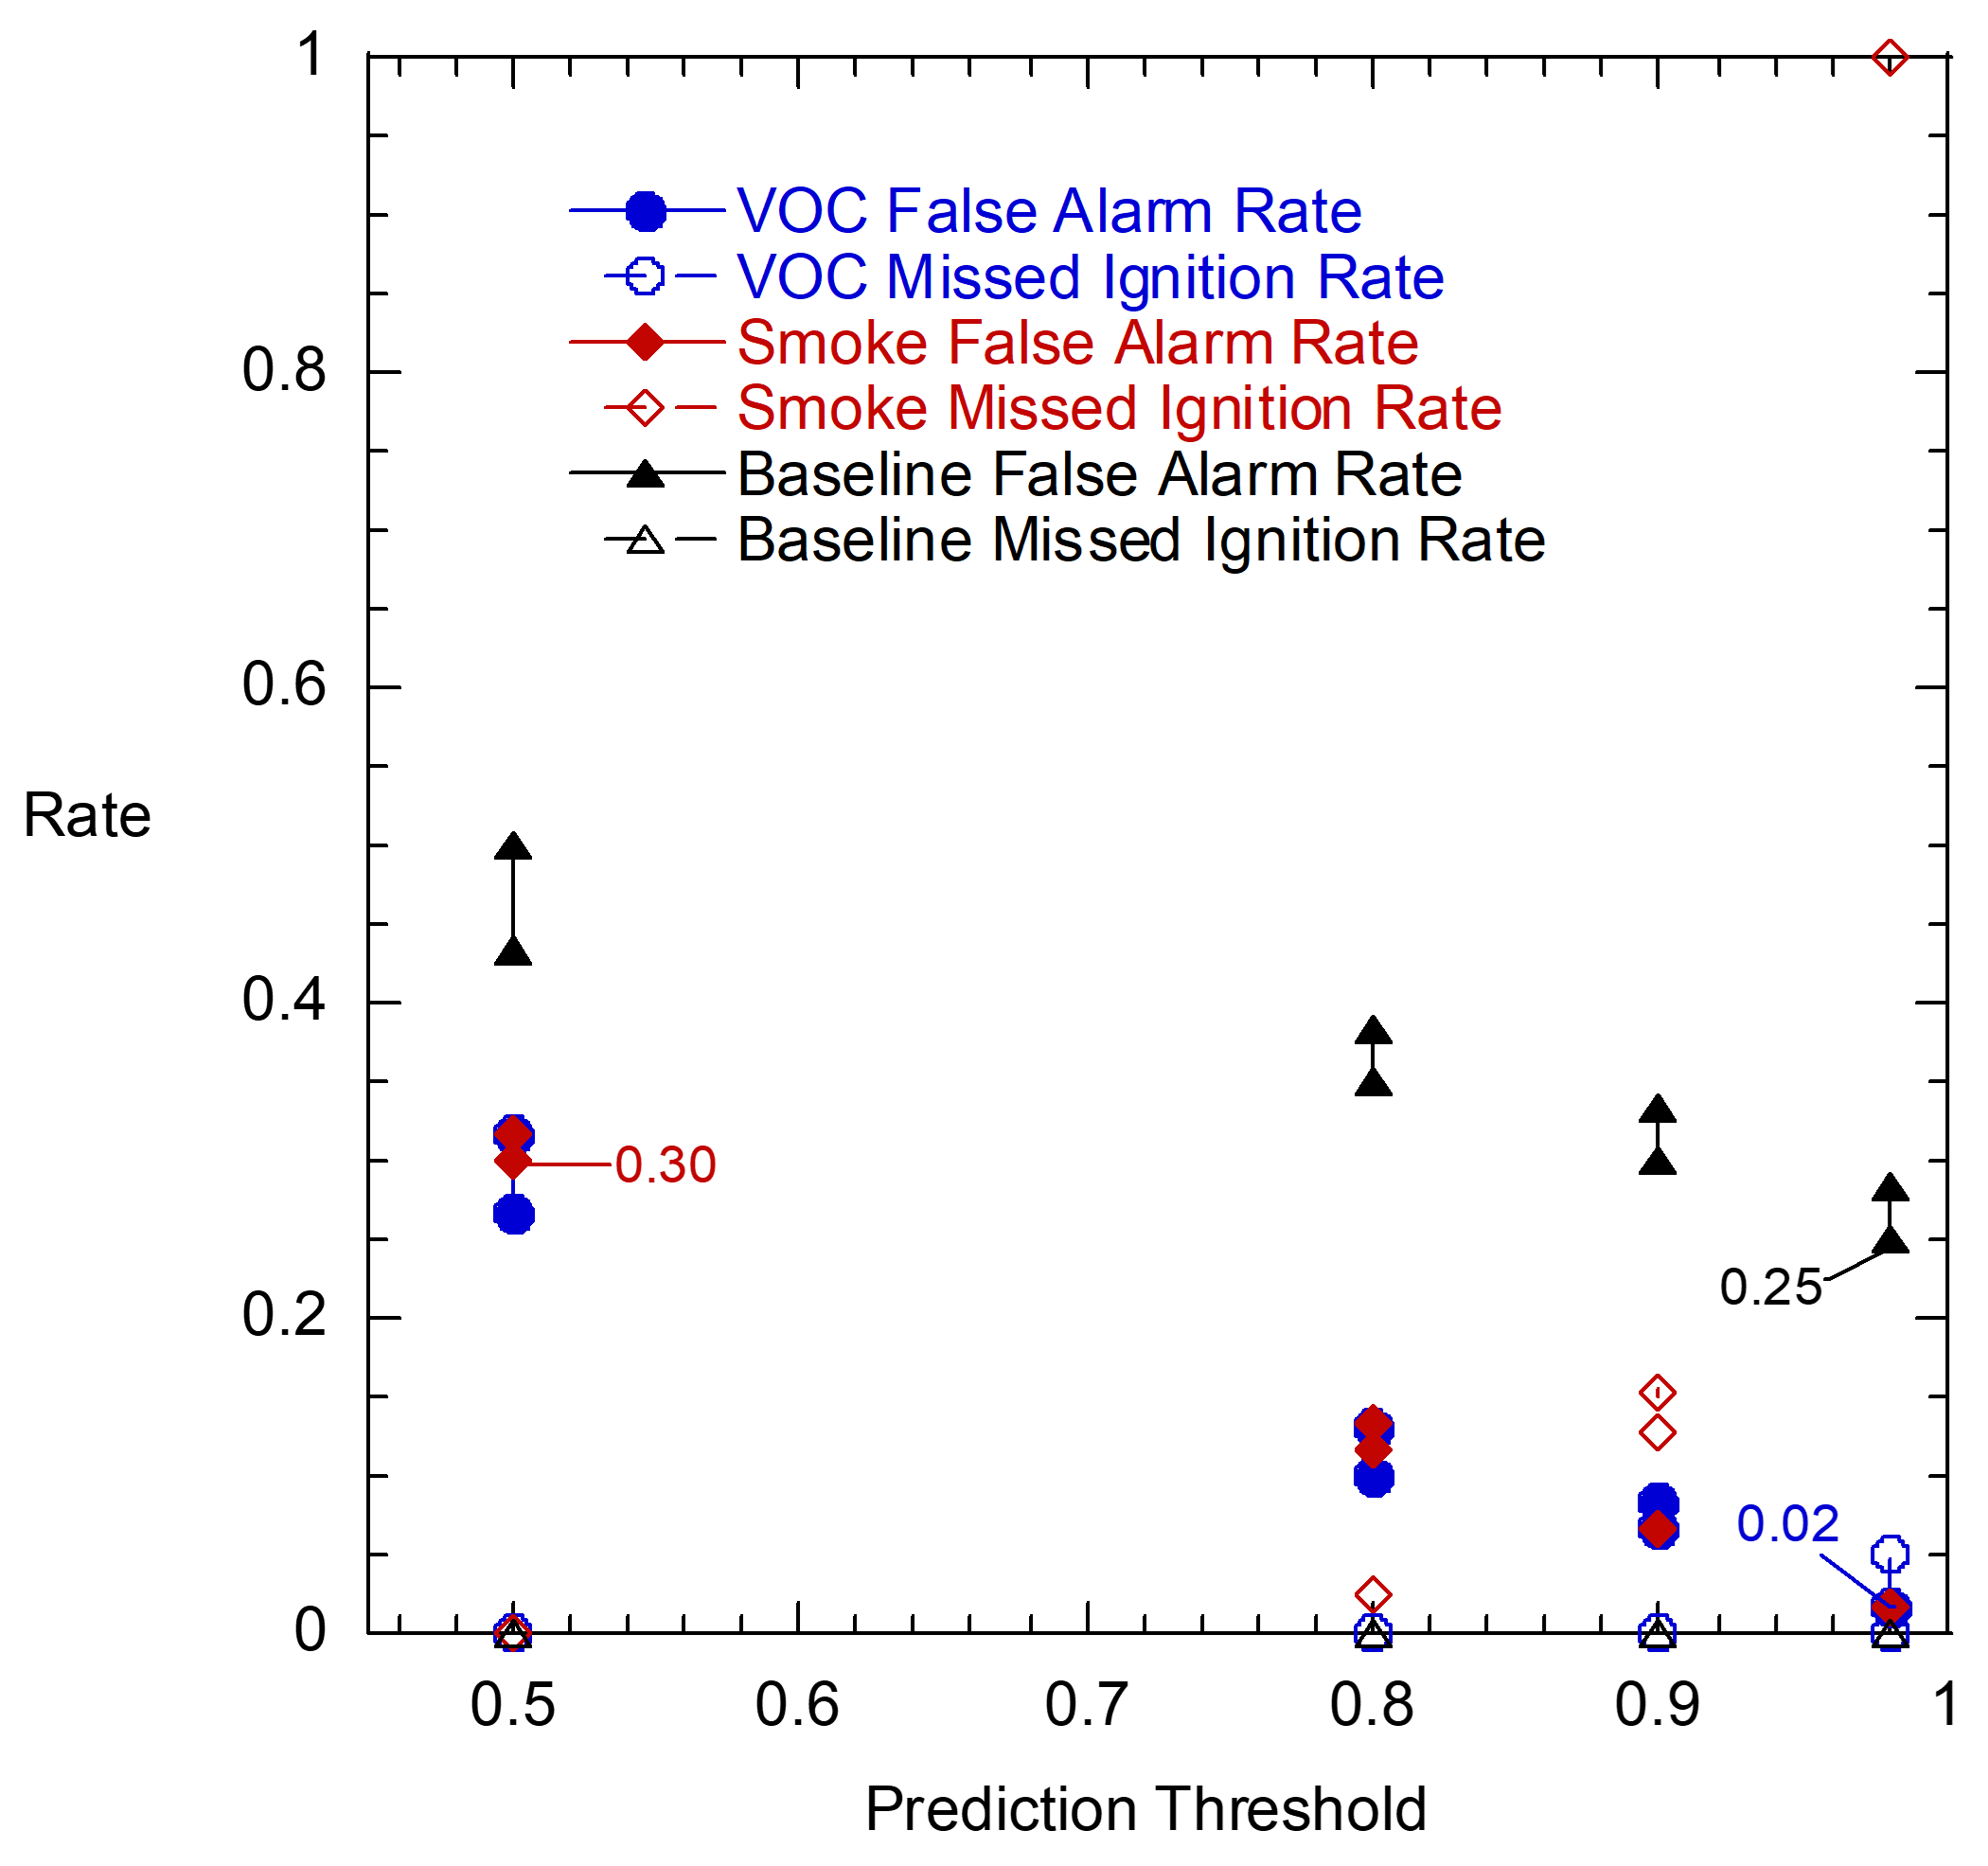
Figure 6. Effect of prediction threshold on neural-network model FAR and MIR. The range in values represents repeat model cases.
The best performing neural-network models (FAR and prediction threshold values in [10]) were based on the VOC sensor alone and on the combination of the VOC and the inexpensive CO sensors, both with FAR of 0.02, matching the best signal threshold performance. The VOC and expensive CO sensor neural-network model also performed well with a 0.03 FAR (2 false alarms). The top performing neural network models (FAR ≤ 0.14) included at least one of the VOC, IAQ or dust sensors. Some neural-network models trained with multiple sensors had similar or improved performance over models trained with only one sensor. This was the case for the CO sensors, which did not perform well individually, but usually complemented other sensors. However, including too many additional sensors resulted in worse performance, as demonstrated by the baseline model, which had a FAR of 0.25.
Conclusions
Both signal threshold analysis and machine learning analysis were in agreement identifying the most effective individual sensors providing early detection of ignition: VOC, IAQ, and dust, and both analyses predicted similar false alarm rates for zero missed ignitions. These three sensors all had a consistent response to the copious amounts of aerosol observed before ignition, which likely include volatile organic compounds and smoke. The combined information from multiple sensors was also evaluated in the threshold analysis using sensor ratios, and in machine learning analysis using the baseline case and sensor pairs, but none of these cases performed better than the VOC sensor alone. Although the results presented here are encouraging, further study is needed to evaluate sensor performance as the sensors age and when other foods and cooking scenarios are considered.
References
- Ahrens M (2017). Home Fires Involving Cooking Equipment. Quincy: NFPA.
- Ahrens M (2020). Home Cooking Fires. Quincy: NFPA
- Underwriter’s Laboratory. (2014). UL 858: Standard for Household Electric Ranges. Northbrook: UL.
- Gottuk DT, Peatross MJ, Roby RJ, Beyler CL (2002). Advanced fire detection using multi-signature alarm algorithms. Fire Safety Journal 37:381–394. https://doi.org/10.1016/S0379-7112(01)00057-1
- Cestari LA, Worrell C, Milke JA (2005). Advanced fire detection algorithms using data from the home smoke detector project. Fire Safety Journal 40:1–28. https://doi.org/10.1016/j.firesaf.2004.07.004
- Gottuk DT, Wright MT, Wong JT, et al (2002). Prototype Early Warning Fire Detection System: Test Series 4 Results. Naval Research Laboratory.
- Johnsson E (1998). Study of Technology for Detecting Pre-Ignition Conditions of Cooking-Related Fires Associated with Electric and Gas Ranges and Cooktops, Final Report. Gaithersburg: National Institute of Standards & Technology.
- Johnsson E, Zarzecki M (2017). Using Smoke Obscuration to Warn of Pre-Ignition Conditions of Unattended Cooking Fires. College Park: AUBE ’17 & SUPDET 2017.
- Jain A, Nyati P, Nuwal N, et al (2014). Pre-Detection of Kitchen Fires due to Auto-Ignition of Cooking Oil and LPG Leakage in Indian Kitchens. Fire Safety Science 11:1285–1297. https://doi.org/10.3801/IAFSS.FSS.11-1285
- Mensch AE, Hamins A, Tam WC, et al (2021). Sensors and Machine Learning Models to Prevent Cooktop Ignition and Ignore Normal Cooking. Fire Technol. https://doi.org/10.1007/s10694-021-01112-2
- Cleary TG (2016). A study on the performance of current smoke alarms to the new fire and nuisance tests prescribed in ANSI/UL 217-2015. Gaithersburg: National Institute of Standards and Technology.
- Underwriter’s Laboratory. (2015). UL/ANSI, 217 Standard for Safety Smoke Alarms. Northbrook: UL.
- Ash M (2016). Edible fats and oils: U.S. Supply and disappearance, 2002/03-2015/16. Economic Research Service, United States Department of Agriculture.
- Dinaburg JB, Gottuk DT (2014). Development of Standardized Cooking Fires for Evaluation of Prevention Technologies: Data Analysis. Gaithersburg: National Institute of Standards and Technology.
- Food Safety and Inspection Service (2019). Safe Minimum Internal Temperature Chart. United States Department of Agriculture.