Experimental and Computational Study of Smoke Dynamics from Multiple Fire Sources Inside a Large-Volume
Gabriele Vigne1,5, Wojciech Węgrzyński3, Alexis Cantizano2, Pablo Ayala2, Guillermo Rein4, Cándido Gutiérrez-Montes1
1 Fluid Dynamics Division of the Department of Mining and Mechanical Engineering, Universidad de Jaén, Jaén, Spain
2 Institute for Research in Technology, ICAI, Universidad Pontificia Comillas, Madrid, Spain
3 Building Research Institute (ITB), Poland
4 Imperial College London, London, UK
5JVVA Fire & Risk – Corresponding author: gabriele.vigne@jvvafire.com
This research presents an experimental and numerical study of the smoke dynamics from four fire sources (combined HRR of 5.2MW) with different ignition times and under transient ventilation conditions, inside a 20 m high cubic atrium. Temperature measurements in the plume and close to the walls have been recorded using 59 thermocouples. The data was used in the determination of the smoke layer interface height, with the least-square and the n-percent methods. Results show that significantly worse conditions are induced by multiple sources than those in a single fire of equal power. The results have been obtained using the CFD code FDS (Fire Dynamics Simulator, v6.7.1). The comparison shows that in the far field the temperature predictions are accurate inside the smoke layer (10 m and 15 m) with discrepancies lower than 10%, whereas higher significant discrepancies were observed at the smoke layer interface, i.e. 5 m high, with discrepancies up to 20%. The analysis confirmed the applicability of FDS to the assessment of the smoke dynamics under complex fire conditions away from flames together with the importance of considering fires with multiple sources due to the faster smoke production compared with single fires.
1 Experimental analysis
Full-scale experiments were performed in the Fire Atrium of the Centro Tecnológico del Metal (CTM), in Murcia, Spain, with the aim of better understanding the fluid dynamics of smoke produced by fires in large enclosures [18] [19]. The Fire Atrium is a full-scale facility that consists of a prismatic structure of 19.5 m x 19.5 m x 17.5 m and a pyramidal roof raised 2.5 m at the center. Both the walls and the roof are made of steel sheets with a thickness of 6 mm and a floor of concrete. The facility was equipped with 59 type-k bare thermocouples, which locations are shown in Figure 2. The atrium implements four variable velocity exhaust fans installed on the roof. The make-up air flows through eight identical grilled vents arranged at the lower parts of the walls whose dimensions are 4.88 x 2.5 m². Those vents can be fully or partially opened, covering part of their section with 1 mm thick steel sheets. Large pans of varying dimensions containing heptane as fuel were used as fire sources (Figure 3b). The experiment was carried out using four pans with a diameter of 0.92 m filled with n-heptane.
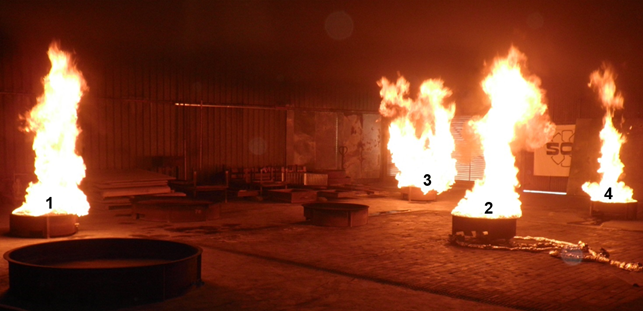
Figure 1– Photo of the experiment with all fires fully developed.
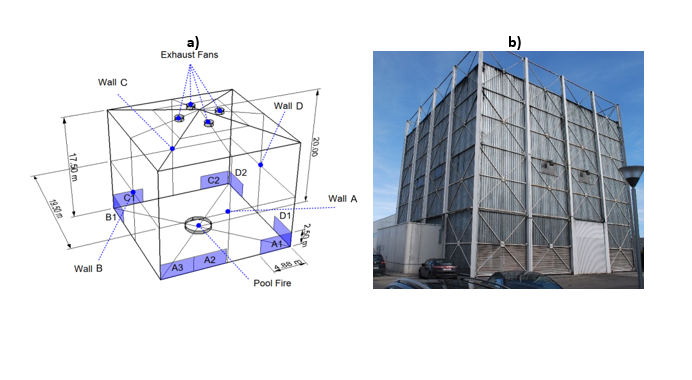
Figure 2 – (a) Geometrical sketch and Photo (b) of the Fire Atrium of the Centro Tecnológico del Metal, Murcia, Spain.
Table 1 – Summary of experimental and ambient conditions during the experiment
Variable
|
Fire1
|
Fire2
|
Fire3
|
Fire4
|
|
Pool diameter (m)
|
0.92
|
0.92
|
0.92
|
0.92
|
|
Fuel mass (kg)
|
18.8
|
12.0
|
14.1
|
14.2
|
|
Burning time (s)
|
662
|
488
|
730
|
783
|
|
Extraction rate (m3/s)
|
18.4 (0 to 360s), 27.6 (360s to end)1
|
|
Ambient temperature (ºC)
|
14.5
|
|
Pressure (Pa)
|
101794
|
|
Maximum combined HRR (MW)
|
5.22
|
|
Open vents
|
A1+A3+C1+C2 (each at 50%)
|
1: Fans A, C: 4.6 m3/s (0 to 360 s), 9.2 m3/s (360 s to end). Fans B, D: 4.6 m3/s
1.1 Numerical Analysis
The numerical simulations have been carried out using Version 6.7.1 of Fire Dynamics Simulator (FDSv6.7.1) [26], [27]. FDS is a computational fluid dynamics (CFD) model of fire-driven fluid flow. FDS solves a form of the Navier-Stokes equations appropriate for low-speed (Ma < 0.3), thermally-driven flow with an emphasis on smoke and heat transport from fires. The model used to account for combustion was the Eddy Dissipation Concept (EDC) model with a thermal extinction model. Moreover, flow turbulence was modelled using a Large Eddy Simulation (LES), Deardorff model (Cv = 0.1), and the radiation was solved with Discrete Ordinates model in a Finite Volume Method with 100 radiation angles [27]. The pool fires were modelled setting the measured HRR curve from the experiment as an input, Figure 3 (a), with a combined total HRR curve, and a peak value of 5.2 MW, shown in Figure 3 (b). The radiation fraction for the heptane was 0.35 [27].
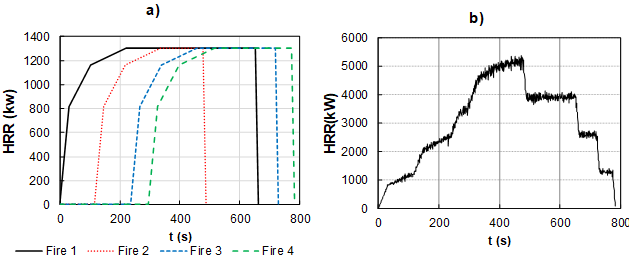
Figure 3 – (a) HRR assigned to each fire and (b) Total HRR as a result of the FDS model for the #4FX experiment.
2 Results
Focusing on the experimental measurements and corresponding numerical predictions, Figure 4a–c shows the near-field temperature, specifically the fire plume temperatures at h = 5.25 m, 7.25 m and 13.25 m (sensors 1, 3 and 5) for the pool fire n.2. The temperature in this region is very high due to the proximity to the flame and the combustion products are not diluted with air, above all at 5.25 m, Figure 4a. The temperature decreases as the height increases due to the make-up air entrainment to the fire plume, Figure 4b, c. These measurements are highly affected by flame local effects, e.g. flame inclinations. The latter explains the discrepancies observed at h=5.25 m above pool 2. When the flame leans, the plume deviates from the vertical axis, and, thus, lower temperatures than the measured ones are predicted, Figure 4a. On the other hand, the results of the simulation for the plume temperature at 5.25 m from the ground start to match after 500s from the ignition, when the central fire is over, and the thermal contribution comes from the other 3 fires. At h=7.25 m, Figure 4b, the plume has enlarged, which reduces the flame deviation effect significantly to be negligible. At higher locations, Figure 4c, good agreement is found between measurements and numerical results. Furthermore, at the lower locations, i.e. h=5.25 and h=7.25 m, four experimental temperature peaks can be appreciated, at t=180, t=210, t=300, and t=430 s, approximately, which are caused by flame deviations provoked by the cross make-up air supply distribution [23]. As it has been above mentioned, these peaks are hardly noticeable at h=13.25 m.
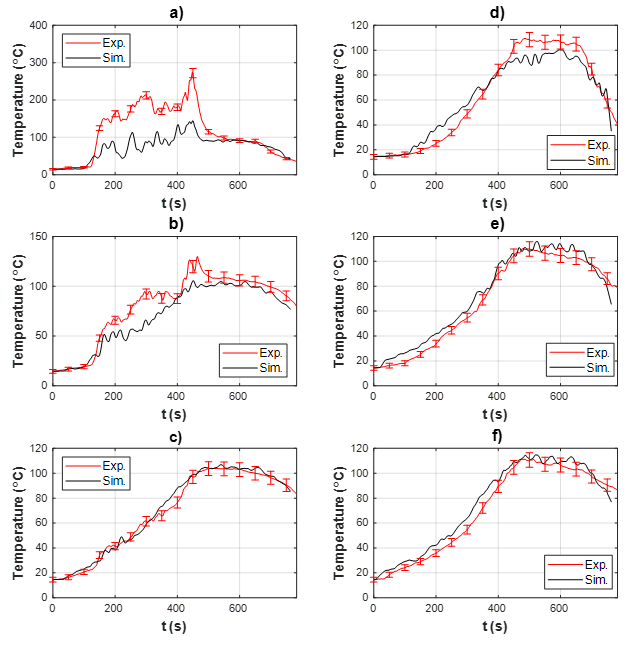
Figure 4 – Experiment #4FX. Temperatures and experimental uncertainty bounds. Fire plume for the pool fire n.2 (central pan) at (a) h = 5.25 m (sensor 1), (b) h = 7.25 m (sensor 3), and (c) h = 13.25 m (sensor 5). At 30 cm from Wall A at (d) h = 5 m (sensor 14), (e) h = 10 m (sensor 16) and (f) h = 15 m (sensor 18).
With regard to the far field, Figure 4d–f shows the temperature measurements at three sensors close to wall A (sensors 14, 16 and 18). The temperature at this region is lower and starts to rise later as a consequence of the travelling time of the smoke from the fire plume to the smoke layer and its subsequent growth. In general, the same trends are noticed in the experiments and the simulations, with a good match for the sensors at 10 m and 15 m height from the ground, Figure 4e and Figure 4f, and a small underprediction of the peak temperature for the lowest thermocouple (at 5 m from the ground, Figure 4d).
Finally, Figure 5 shows the smoke layer drop and the experimental vertical temperature profiles every 100 s. The least-squares methods have been used and the error was estimated by means of absolute and relative discrepancies. The latter error was calculated with respect to the total atrium height (20 m). These two methods have been used to assess their accuracy in representing the smoke layer height. The height of the smoke layer has also been numerically evaluated using the least-squares method applied to the same thermocouple locations as in the experiments, Figure 5a. When compared to the simulation, the smoke layer interface shows the same trend with an overall substantial underprediction of the smoke layer interface. More specifically, the difference with respect to the experimental measurements is minimal during the smoke layer drop (from the ignition to approximately 150 s). However, after 150 s, the difference between the smoke layer determined by the model and the experiments reaches a value of 1.8 m (at approximately 550 s). Such difference might be caused in part by a larger mixing process at the smoke layer interface predicted by the simulation, as it has been previously shown.
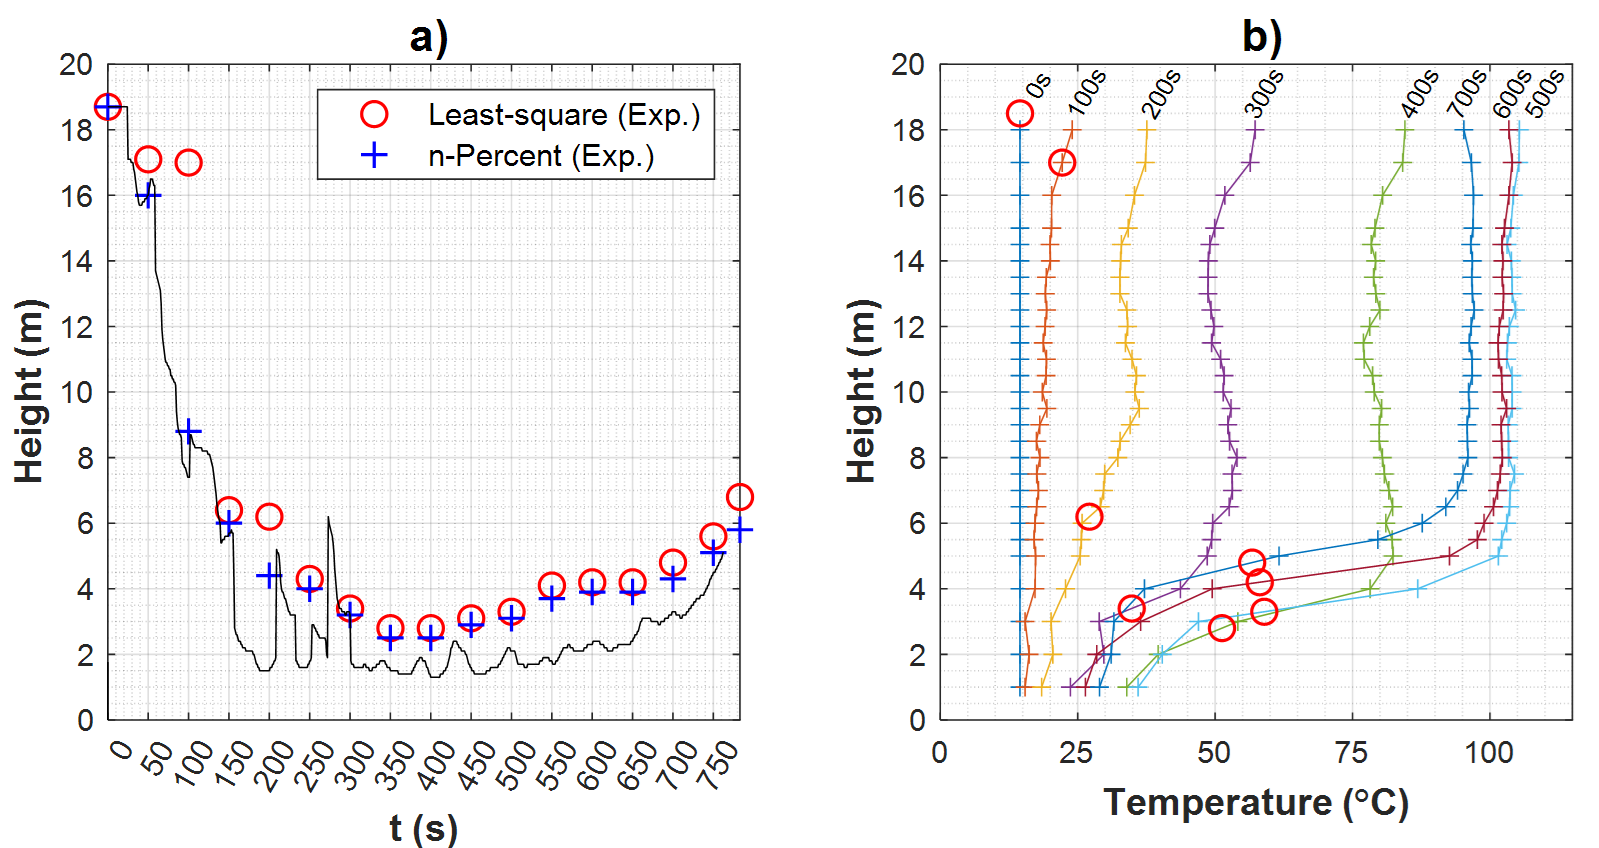
Figure 5 – Experiment #4FX. (a) Smoke layer drop. (b) Experimental smoke layer temperature profiles every 100 s. The red circles on figure (b) indicate the location of the smoke layer interface height calculated with a given profile.
The experimental vertical temperature profiles in Figure 5b shows how the temperature is not very uniform through the smoke layer as it grows, mainly caused by the ignition of the fires at different locations. At 360 s, the smoke exhaust is increased, and the smoke layer interface starts to rise. It can be observed how the ventilation system also homogenizes the temperature through the smoke layer, reaching a very uniform maximum value. Then, the smoke layer starts to decrease its temperature, in the same way, very homogenously.
3 Conclusions
Overall, good agreement has been found in the four fires experiment between the numerical data and the experimental measurements in the near field, and also in the far field. In the near field, out of the flame region, the numerical temperature is slightly underpredicted, with average discrepancies lower than 10%. In the far field, the temperature predictions are quite accurate inside the smoke layer (10 m and 15 m), whereas larger discrepancies were observed at the smoke layer interface, i.e. 5 m high. The discrepancies at 10 m and 15 m high are lower than 10%, whereas at 5 m discrepancies up to 20% can be found, which is within the uncertainty associated with FDS. Lower smoke layer height is predicted by the simulations, caused by the larger mixing of fresh air and smoke, induced by the complex flow field at low locations. The analysis confirms that FDS is a robust tool in determining the smoke spread and its features away from the fire region. Finally, the results show the importance of considering complex fire scenarios with multiple sources due to the faster smoke production and more life-threatening induced conditions compared with those of traditional single fires.
4 Acknowledgements
The authors want to acknowledge Sodeca, Xtralis, JVVA and Fundación Mapfre for their support during the full-scale fire tests, the National Institute of Standard and Technology for making FDS available, the Centro Tecnológico del Metal for the test facility Murcia Fire Atrium, the Universities involved in this research, Universidad de Jaén, Universidad Pontificia Comillas, Imperial College London and the research center ITB Poland.
5 References
[1] C. Gutiérrez-Montes, G. Rein, E. Sanmiguel-Rojas, A. Viedma, Smoke and fire dynamics in atria and large enclosures: an overview. Fire SafetyNova Science Publishers, New York (2009).
[2] S. Kerber y J. A. Milke, «Using FDS to Simulate Smoke Layer Interface Height in a Simple Atrium», Fire Technol, vol. 43, n.o 1, pp. 45-75, mar. 2007, doi: 10.1007/s10694-007-0007-7.
[3] T. X. Qin, Y. C. Guo, C. K. Chan, y W. Y. Lin, «Numerical simulation of the spread of smoke in an atrium under fire scenario», Building and Environment, vol. 44, n.o 1, pp. 56-65, ene. 2009, doi: 10.1016/j.buildenv.2008.01.014.
[4] G. Vigne, C. Gutierrez-Montes, A. Cantizano, W. Węgrzyński, y G. Rein, «Review and Validation of the Current Smoke Plume Entrainment Models for Large-Volume Buildings», Fire Technology, vol. 55, n.o 3, pp. 789-816, may 2019, doi: 10.1007/s10694-018-0801-4.
[5] S. Suard, A. Koched, H. Pretrel, y L. Audouin, «Numerical simulations of fire-induced doorway flows in a small scale enclosure», International Journal of Heat and Mass Transfer, vol. 81, pp. 578-590, feb. 2015, doi: 10.1016/j.ijheatmasstransfer.2014.10.069.
[6] Chen, Yanqiu, Xiaodong Zhou, Zhijian Fu, Taolin Zhang, Bei Cao, and Lizhong Yang. 2016. “Vertical Temperature Distributions in Ventilation Shafts during a Fire.” Experimental Thermal and Fluid Science 79: 118–25. https://doi.org/10.1016/j.expthermflusci.2016.07.007.
[7] W. Węgrzyński, «Transient characteristic of the flow of heat and mass in a fire as the basis for optimized solution for smoke exhaust», International Journal of Heat and Mass Transfer, vol. 114, pp. 483-500, nov. 2017, doi: 10.1016/j.ijheatmasstransfer.2017.06.088.
[8] Mercier, G P, and Y Jaluria. 1999. “Fire-Induced Flow of Smoke and Hot Gases in Open Vertical Enclosures.” Experimental Thermal and Fluid Science 19: 77–84.
[9] C. L. Shi, W. Z. Lu, W. K. Chow, y R. Huo, «An investigation on spill plume development and natural filling in large full-scale atrium under retail shop fire», International Journal of Heat and Mass Transfer, vol. 50, n.o 3, pp. 513-529, feb. 2007, doi: 10.1016/j.ijheatmasstransfer.2006.07.020.
[10] Reszka, P, T Steinhaus, A Cowlard, H Biteau, S Welch, G Rein, and J L Torero. 2008. “Characterisation of Dalmarnock Fire Test One.” Experimental Thermal and Fluid Science 32: 1334–43. https://doi.org/10.1016/j.expthermflusci.2007.11.006.
[11] M. Zahirasri, M. Tohir, M. Spearpoint, y C. Fleischmann, «Prediction of time to ignition in multiple vehicle fire spread experiments», doi: 10.1002/fam.2458.
[12] S. Shafee y A. Yozgatligil, «An experimental study on the burning rates of interacting fires in tunnels», Fire Safety Journal, vol. 96, pp. 115-123, 2018, doi: https://doi.org/10.1016/j.firesaf.2018.01.004.
[13] K. He, X. Cheng, Y. Yao, L. Shi, H. Yang, y W. Cong, «Characteristics of multiple pool fires in a tunnel with natural ventilation», Journal of Hazardous Materials, vol. 369, pp. 261-267, may 2019, doi: 10.1016/j.jhazmat.2019.02.041.
[14] X. Zhao, C. Chen, C. Shi, J. Chen, y D. Zhao, «An extended model for predicting the temperature distribution of large area fire ascribed to multiple fuel source in tunnel», Tunnelling and Underground Space Technology, vol. 85, pp. 252-258, mar. 2019, doi: 10.1016/j.tust.2018.12.013.
[15] H. Wan, Z. Gao, J. Ji, y Y. Zhang, «Experimental study on flame radiant heat flux from two heptane storage pools and its application to estimating safety distance», Energy, vol. 182, pp. 11-20, sep. 2019, doi: 10.1016/j.energy.2019.06.006.
[16] W. G. Weng, D. Kamikawa, Y. Fukuda, Y. Hasemi, y K. Kagiya, «Study on Flame Height of Merged Flame from Multiple Fire Sources», Combustion Science and Technology, vol. 176, n.o 12, pp. 2105-2123, dic. 2004, doi: 10.1080/00102200490514949.
[17] P He, P Wang, K Wang, X Liu, C Wang, C Tao, Y Liu, «The evolution of flame height and air flow for double rectangular pool fires», Fuel, vol. 237, pp. 486-493, feb. 2019, doi: 10.1016/j.fuel.2018.10.027.
[18] C. Gutiérrez-Montes, E. Sanmiguel-Rojas, A. S. Kaiser, y A. Viedma, «Numerical model and validation experiments of atrium enclosure fire in a new fire test facility», Building and Environment, vol. 43, n.o 11, pp. 1912-1928, 2008, doi: 10.1016/j.buildenv.2007.11.010.
[19] P. Ayala, A. Cantizano, G. Rein, G. Vigne, y C. Gutiérrez-Montes, «Fire Experiments and Simulations in a Full-scale Atrium Under Transient and Asymmetric Venting Conditions», Fire Technology, vol. 52, n.o 1, pp. 51-78, ene. 2016, doi: 10.1007/s10694-015-0487-9.
[20] P. Ayala, A. Cantizano, C. Gutiérrez-Montes, y G. Rein, «Influence of atrium roof geometries on the numerical predictions of fire tests under natural ventilation conditions», Energy and Buildings, vol. 65, pp. 382-390, 2013, doi: 10.1016/j.enbuild.2013.06.010.
[21] P. Ayala, A. Cantizano, E. F. Sánchez-Úbeda, y C. Gutiérrez-Montes, «The Use of Fractional Factorial Design for Atrium Fires Prediction», Fire Technol, pp. 1-24, jul. 2016, doi: 10.1007/s10694-016-0609-z.
[22] C. Gutiérrez-Montes, E. Sanmiguel-Rojas, y A. Viedma, «Influence of different make-up air configurations on the fire-induced conditions in an atrium», Building and Environment, 2010, doi: 10.1016/j.buildenv.2010.05.006.
[23] P. Ayala, A. Cantizano, G. Rein, y C. Gutiérrez-Montes, «Factors affecting the make-up air and their influence on the dynamics of atrium fires», Fire technology, vol. 54, n.o 4, pp. 1067–1091, 2018.
[24] T. Beji, S. Verstockt, R. Van de Walle, y B. Merci, «Prediction of smoke filling in large volumes by means of data assimilation–based numerical simulations», Journal of Fire Sciences, vol. 30, n.o 4, pp. 300-317, jul. 2012, doi: 10.1177/0734904112437845.
[25] L. Y. Cooper, M. Harkleroad, J. Quintiere, y W. Rinkinen, «An Experimental Study of Upper Hot Layer Stratification in Full-Scale Multiroom Fire Scenarios», Journal of Heat Transfer, vol. 104, n.o 4. p. 741, 1982, doi: 10.1115/1.3245194.
[26] K. McGrattan, S. Hostikka, R. McDermott, J. Floyd, C. Weinschenk, y K. Overholt, «Fire Dynamics Simulator technical reference guide», NIST Special Publication 1018-1. US Department of Commerce, National Institute of Standards and Technology. Gaithersburg, MD., vol. 1, n.o 5, p. 175, 2016, doi: 10.6028/NIST.SP.1018-1.
[27] K. McGrattan, S. Hostikka, J. Floyd, R. McDermott, M. Vanella, «Fire Dynamics Simulator user's guide», NIST Special Publication 1018-1. US Department of Commerce, National Institute of Standards and Technology. Gaithersburg, MD., vol. 1, n.o 5, p. 175, 2016, doi: 10.6028/NIST.SP.1019
[28] Thunderhead Engineering, «PyroSim User Manual», p. 167, 2017
[29] M. J. Hurley et al., Eds., SFPE Handbook of Fire Protection Engineering, 5th ed. New York, NY: Springer New York, 2016.
[30] U. NIC, Verification and validation of selected fire models for nuclear power plant applications, n.o April. 2006.
[31] Thunderhead Engineering, «PyroSim Results User Manual», 2019.
[32] W. Węgrzyński, G. Vigne, «Experimental and numerical evaluation of the influence of the soot yield on the visibility in smoke in CFD analysis», Fire Safety Journal, vol. 91, n.o SI, pp. 389-398, jul. 2017, doi: 10.1016/j.firesaf.2017.03.053.
[33] M. L. Yaping He, Anthony Fernando, «Determination of interface height from measured parameter profile in enclosure fire experiment», Fire Safety Journal, vol. 31, n.o 1, pp. 19-38, 1998.